Why Gross Churn Rate Doesn't Tell the Whole Story

Gross churn rate is one of those SaaS metrics that gets repeated so often people stop questioning it.
A founder posts a tidy dashboard screenshot. A board pack highlights monthly gross churn. A metrics template gives it a prime spot next to MRR, CAC, and payback period. Everyone nods along because gross churn feels simple.
Simple is nice. Simple is also dangerous when it hides the real problem.
Gross churn rate tells you how much recurring revenue or how many customers you lost over a period before expansion revenue offsets anything. That matters. You should absolutely track it. But if you use gross churn rate as the main story about retention health, you can make dumb decisions fast.
The metric does not tell you why customers left, whether recoverable revenue was sitting inside failed payments, whether expansion masked product problems, or whether your customer mix changed in ways that make the number look better or worse than reality. It is a useful lens, not the whole camera.
For SaaS founders using Stripe, this gets even more important because some churn that shows up as lost recurring revenue is not really a customer choosing to leave. It is billing friction, failed payments, expired cards, authentication issues, or sloppy recovery flows. If you only stare at gross churn rate, those operational leaks hide inside a single top-line percentage.
This is why gross churn rate does not tell the whole story, what it misses, and which supporting metrics you actually need if you want to understand retention instead of just reporting on it.
What gross churn rate actually measures
At its simplest, gross churn rate measures revenue or customers lost during a period, without giving you credit for expansion.
There are two common versions:
- Customer gross churn: the percentage of customers lost in a period.
- Revenue gross churn: the percentage of recurring revenue lost in a period before upgrades or expansion offset anything.
Most serious SaaS teams care more about revenue gross churn because losing a £20 customer and losing a £2,000 customer are not remotely the same event.
A simplified revenue formula looks like this:
Gross revenue churn = churned MRR plus contraction MRR, divided by starting MRR for the period.
That makes gross churn rate useful because it answers a clean question: how much recurring revenue leaked out of the bucket this month?
That question matters. If the leak is big enough, growth gets eaten alive. If the leak is small, you have more room to scale acquisition efficiently.
The mistake is not tracking gross churn. The mistake is treating it like a full retention diagnosis.
Why founders love gross churn rate a little too much
Founders like gross churn rate because it does three attractive things.
First, it is easy to explain. Second, it looks respectable in a dashboard. Third, it creates the illusion of control.
You can say, "Our gross churn is 2.8%" and it sounds precise. But precision is not the same as understanding.
A single gross churn number compresses a messy reality into one clean percentage. That is great for investor updates. It is lousy for deciding what to fix next.
Two companies can report the same gross churn rate and have completely different businesses underneath:
- Company A has real product dissatisfaction and weak onboarding.
- Company B has solid retention but loses revenue to expired cards and failed payment recovery gaps.
On paper, both might show 3% gross churn. Operationally, they need completely different interventions.
If you are running Stripe, this is where it helps to separate customer intent from billing failure. A churn dashboard that does not split those causes is flattering nonsense.
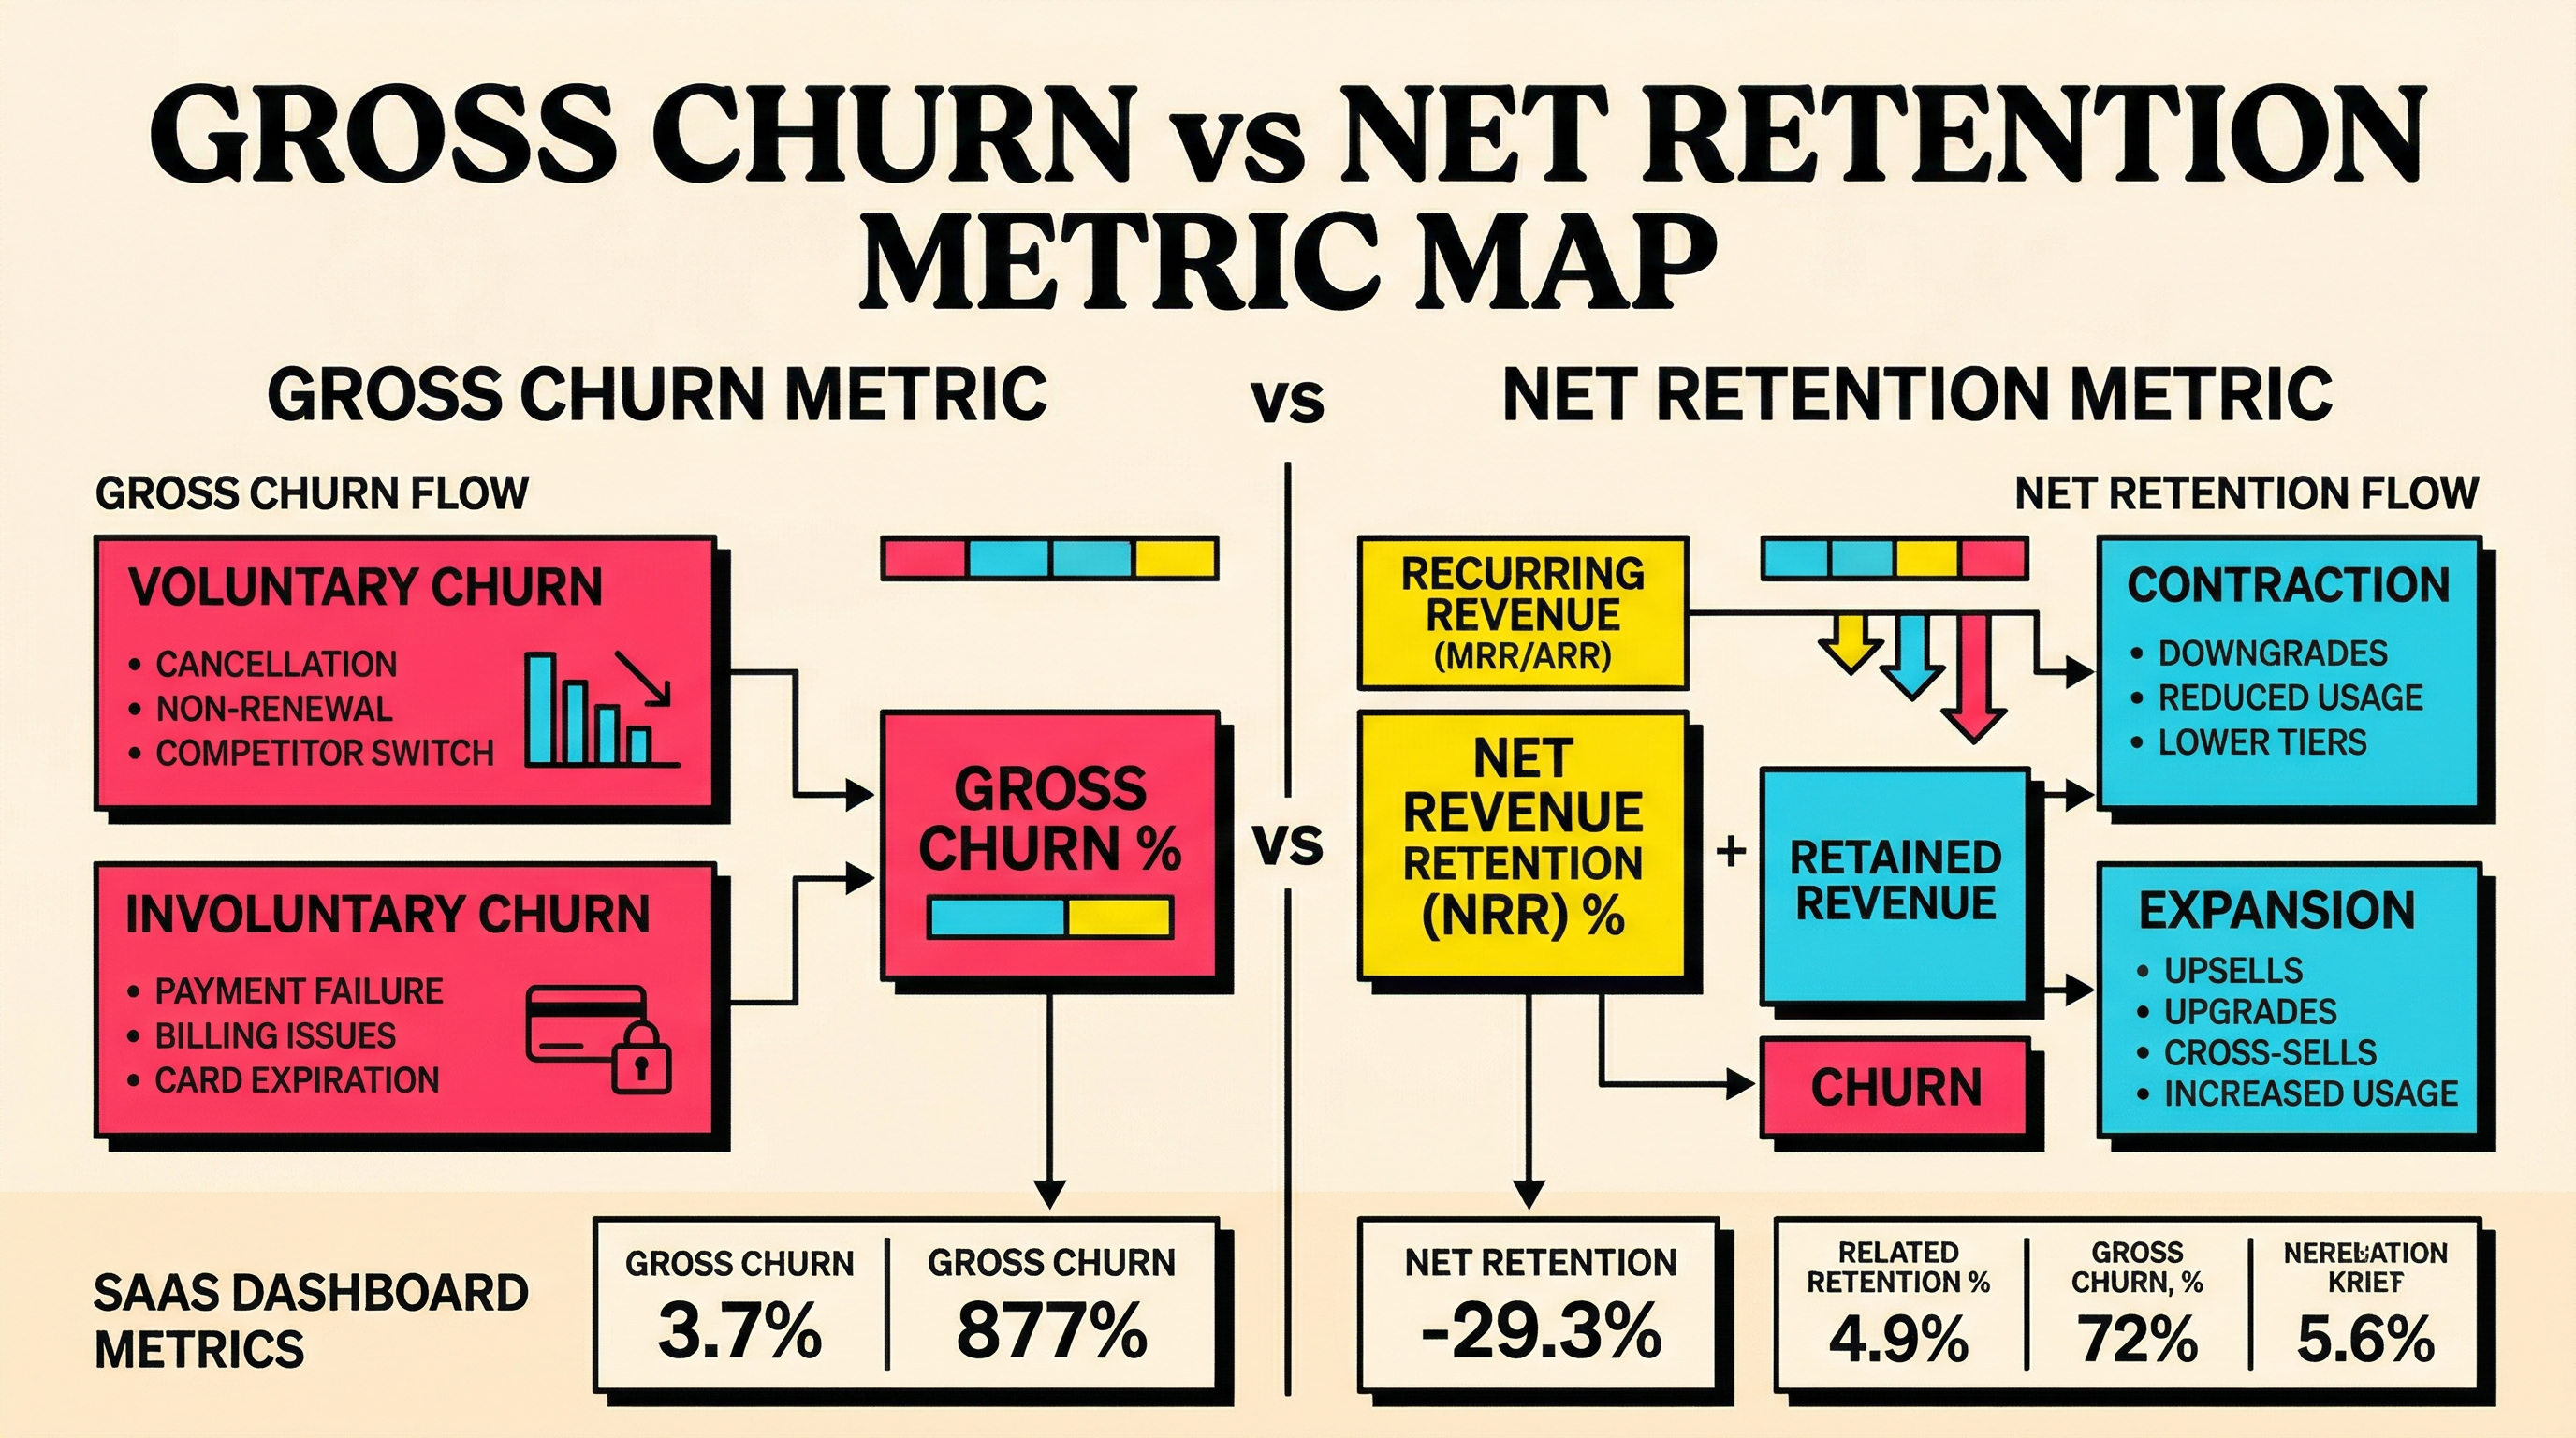
Gross churn rate misses the difference between voluntary and involuntary churn
This is the first big blind spot.
Gross churn rate lumps together revenue lost because customers wanted out and revenue lost because the payment system failed to collect.
Those are not the same problem.
Voluntary churn usually points to product, positioning, pricing, support, competition, or customer fit. Involuntary churn usually points to billing operations: card expiry, insufficient funds, authentication friction, stale payment methods, weak dunning, or poor retry timing.
If you do not break these apart, you cannot assign the right owner.
A product team cannot fix expired cards with better onboarding. A finance or lifecycle team cannot fix a bad ICP with prettier dunning emails. When gross churn rate rolls both together, it turns accountability into mush.
This is also why benchmark context matters. If your overall churn looks high, compare it against broader SaaS churn benchmarks, then isolate how much of the gap is real retention versus recoverable billing loss.
Gross churn rate does not tell you whether the loss was actually recoverable
Here is the part a lot of teams miss.
Some lost MRR was gone no matter what. Some was extremely recoverable with a better billing system.
Imagine two failed invoices:
- One customer cancelled because the product no longer fits their workflow.
- Another customer hit an expired-card decline, never saw the billing email, and would have paid if the update path were cleaner.
Gross churn rate treats both as lost revenue. But only one of them was realistically available for recovery.
If you want to improve retention, that distinction is everything.
Recoverable revenue needs its own operating view. You need to know:
- how much failed-payment MRR entered recovery
- how much got recovered
- how quickly it recovered
- which decline reasons had the highest save potential
- which cohorts consistently failed to recover
Without this, gross churn rate quietly trains you to accept preventable losses as normal.
That is a terrible habit.
If you need a practical reference for the billing side, the Stripe decline codes library is useful because it pushes you to classify revenue loss by cause instead of shrugging at a blended number.
Gross churn rate can hide a billing-ops problem inside an apparently healthy company
This happens all the time in subscription businesses.
The company is growing. Net retention looks passable. Sales are closing. The product is fine. Yet recoverable revenue keeps slipping through because nobody owns the failed-payment workflow end to end.
The warning signs usually look like this:
- a rising share of invoice failures from expired cards or authentication-required events
- generic dunning emails that do not match the actual problem
- retries firing on a schedule nobody has reviewed in months
- billing update links that create too much friction on mobile
- support tickets where customers say, "I thought I already paid"
Gross churn rate will not tell you any of that. It just reports the final damage.
That is like measuring water on the floor without checking which pipe burst.
For Stripe-heavy businesses, this is why billing instrumentation matters as much as product analytics. You need to know where revenue is leaking before it becomes a headline metric.
Gross churn rate ignores account composition changes
Another reason gross churn can mislead you is that the customer base itself changes over time.
Suppose last year you had lots of small self-serve accounts. This year you have fewer but larger accounts. The same churn rate now carries a different business meaning.
Or suppose you moved upmarket. Customer count churn might worsen while revenue churn improves. Or the reverse. If you only fixate on one gross churn figure, you can misread what the business is actually doing.
This is why gross churn rate should always be read alongside segmentation such as:
- self-serve versus sales-led
- monthly versus annual
- SMB versus mid-market
- new cohorts versus mature cohorts
- geography or payment-method splits
A blended churn number without composition context is a shortcut to the wrong narrative.
Gross churn rate does not explain timing
Retention problems are often temporal before they are structural.
A spike in gross churn might come from a bad onboarding cohort, a pricing experiment, a payment processor issue, a seasonal cash-flow pattern, or a botched product change. The number itself does not tell you which.
That means you need trend and cohort views, not just one monthly summary.
Ask questions like:
- Did churn rise for one acquisition cohort or all of them?
- Did failed payments spike around renewal dates or all month?
- Did one plan tier worsen after a packaging change?
- Did a specific decline reason jump after adding a new authentication step?
Gross churn is the smoke alarm. It is not the fire report.
Gross churn rate says nothing about expansion quality
This one gets messy because people mix gross churn, net churn, and net revenue retention into a single vague retention story.
Gross churn ignores expansion. That is useful because it prevents upsells from masking leakage. But once you isolate gross churn, you still need to understand what expansion is doing and whether it is healthy.
A business with mediocre gross churn can still post strong net retention because a subset of accounts expands aggressively. That can be fine. It can also be fragile.
If a few power users are offsetting broad revenue leakage, the company may look healthier than it really is. On the flip side, a business with decent gross churn but weak expansion may have a monetisation problem rather than a retention problem.
The point is simple: gross churn alone tells you what left. It does not tell you what stayed strong, what expanded, or whether the customer base is becoming more valuable over time.
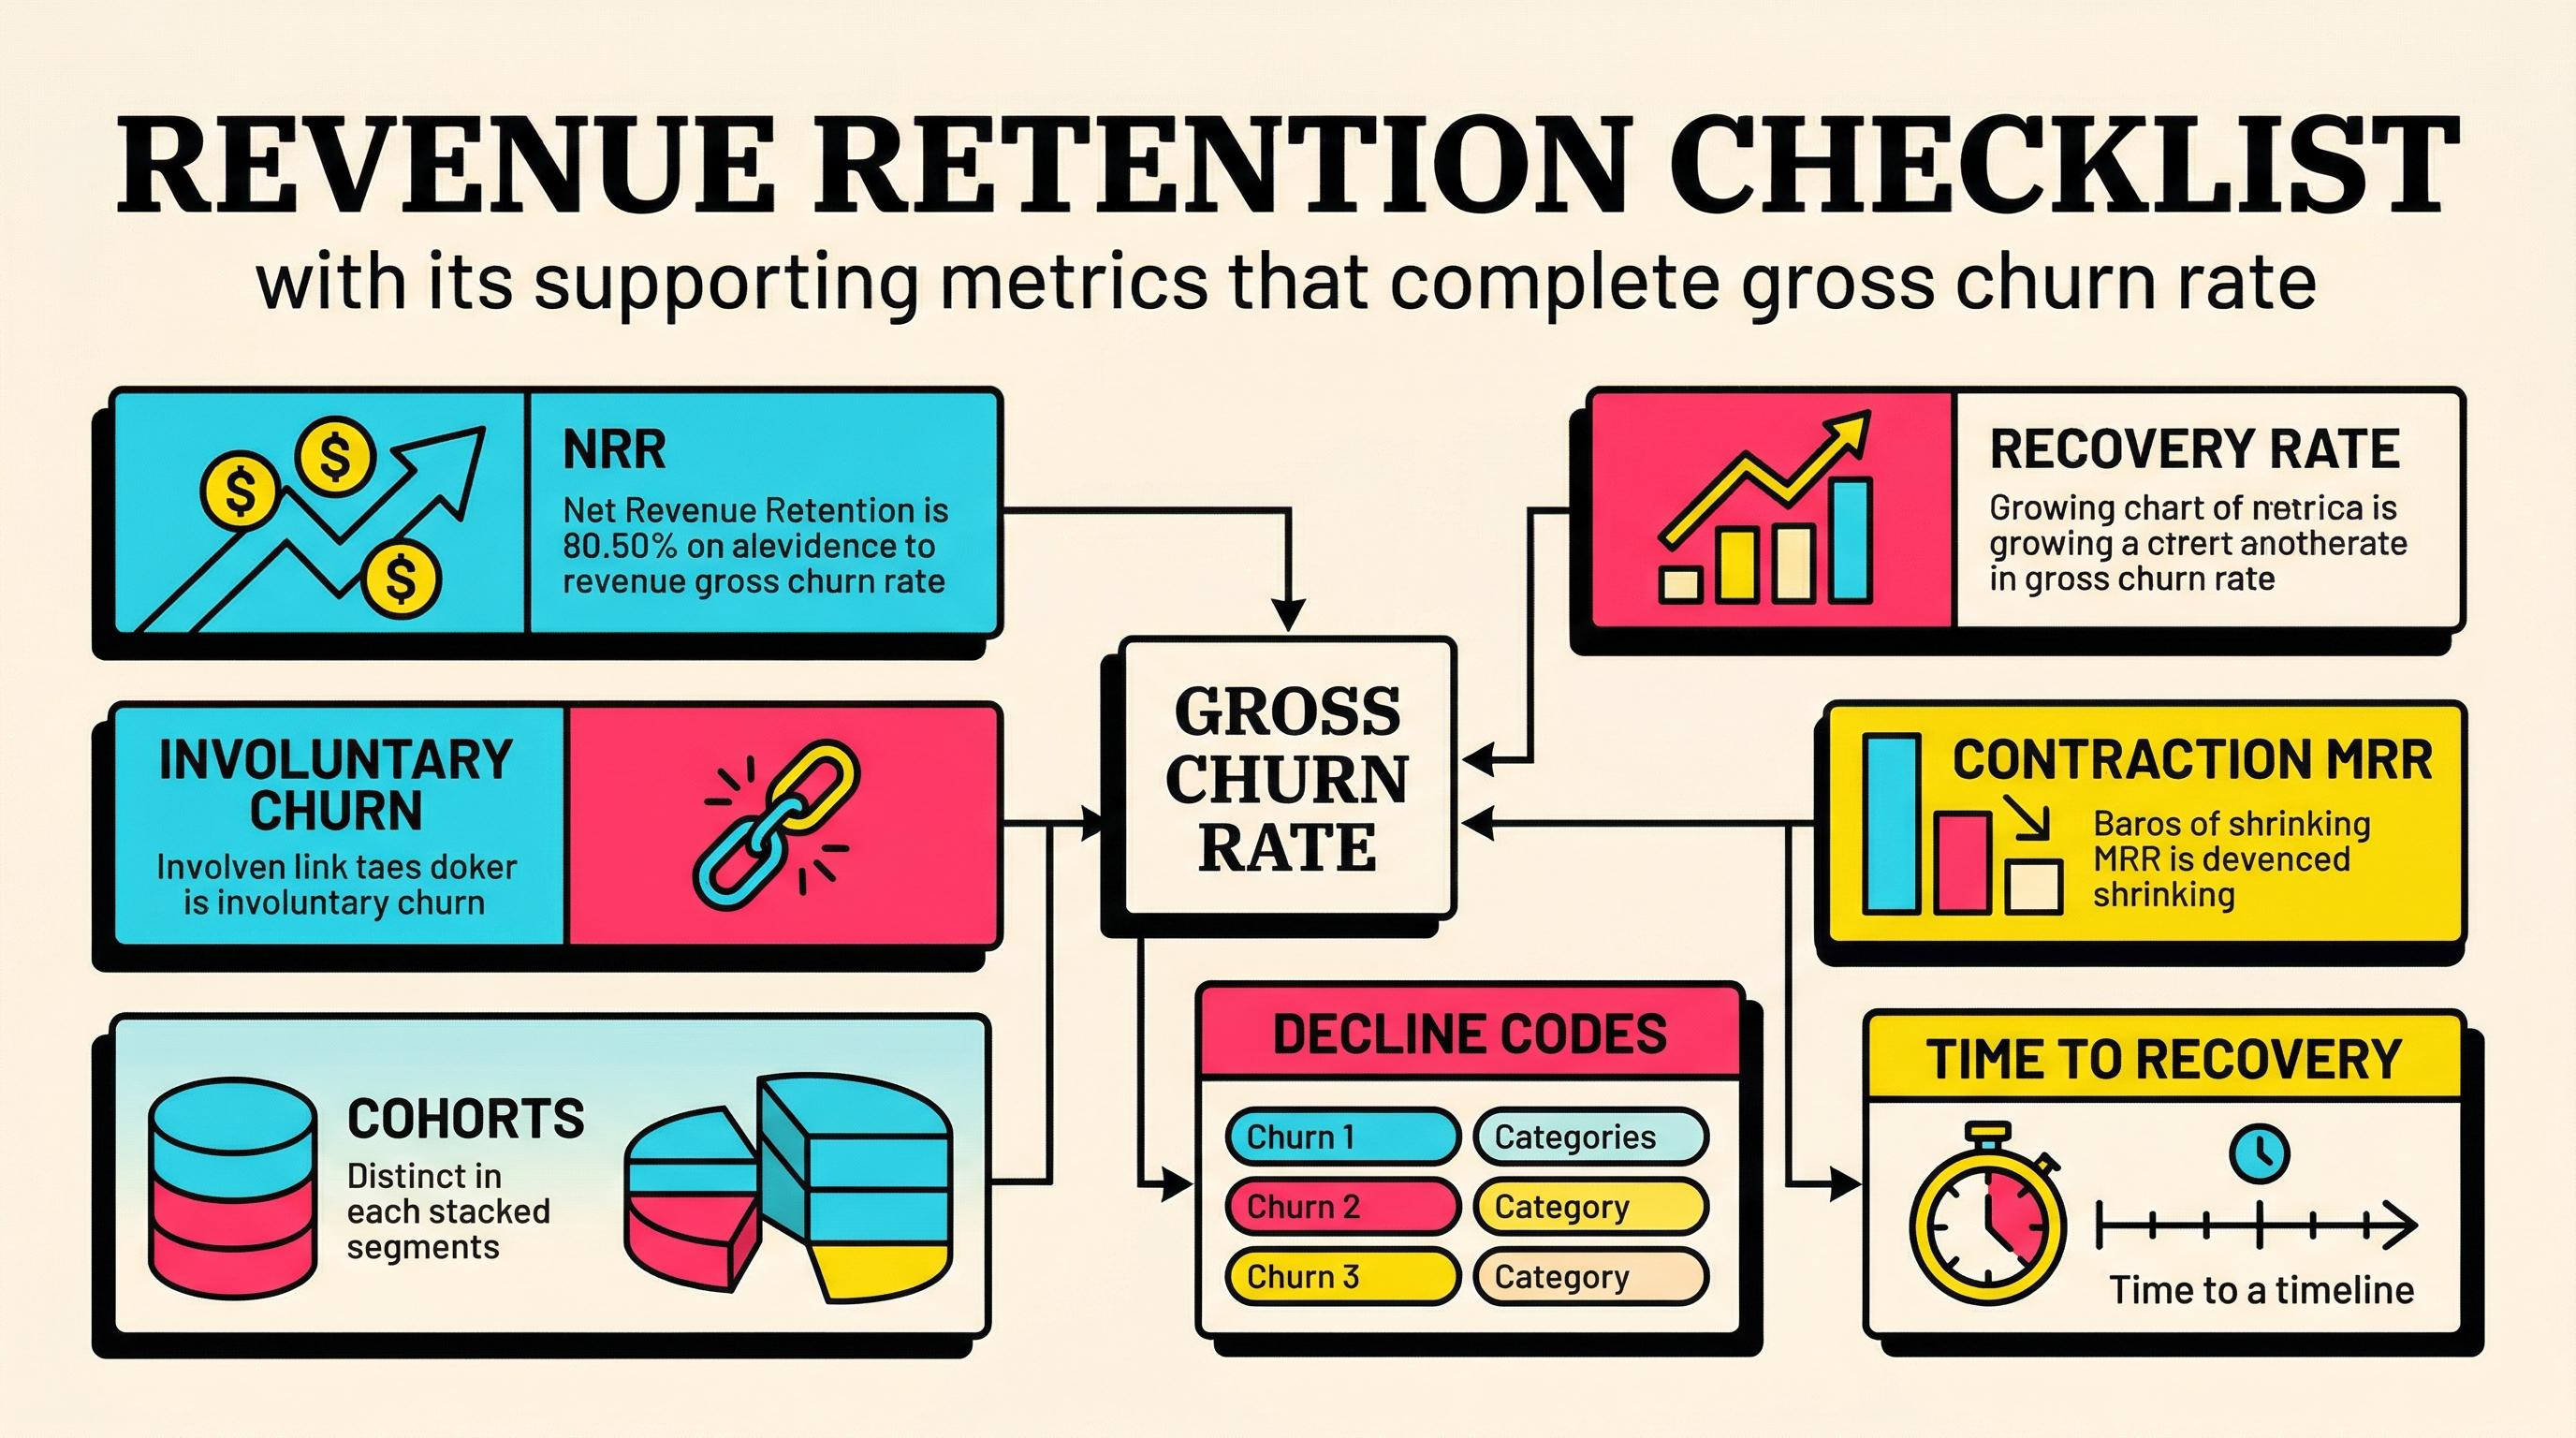
The supporting metrics that actually complete the picture
If you want gross churn rate to become useful instead of misleading, pair it with a small stack of supporting metrics.
1. Net revenue retention
This tells you whether existing customers are growing or shrinking overall after churn, contraction, and expansion. It is the best high-level partner metric to gross churn because it shows whether the base is compounding or eroding.
2. Involuntary churn rate
This tells you how much revenue is being lost to failed payments and billing friction rather than customer choice. If this number is elevated, your retention issue may be more operational than strategic.
3. Failed payment recovery rate
This shows how effective your retry logic, dunning, and billing update flows actually are. It is one of the clearest ways to turn hidden revenue leakage into an actionable systems problem.
4. Contraction MRR
Not every loss is a full cancellation. Downgrades matter. Contraction can tell you a lot about pricing pressure, seat reduction, and weakening account value before full churn shows up.
5. Cohort retention
Cohorts stop you from averaging away the truth. They show whether a specific onboarding period, plan mix, or acquisition source is driving the problem.
6. Decline-code distribution
If you bill in Stripe, you should know which failure reasons dominate. That is how you distinguish insufficient funds from expired cards from authentication-required issues. The fix depends on the cause.
7. Time-to-recovery for failed payments
Not all recovery is equal. If revenue only comes back after a long gap, cash flow and support load still suffer. Recovery speed matters, not just recovery existence.
A better way to use gross churn rate in practice
Use gross churn rate as the headline symptom, not the diagnosis.
A simple founder workflow looks like this:
- Check gross churn rate for the month.
- Break the loss into voluntary churn, involuntary churn, and contraction.
- Review failed-payment recovery performance.
- Look at segment and cohort splits.
- Decide whether the main fix belongs to product, pricing, lifecycle, billing ops, or support.
That process is not glamorous. It is also how you avoid wasting a quarter solving the wrong problem.
For example, if gross churn worsens while involuntary churn spikes and recovery rate drops, do not launch a panic retention project. Fix billing first. If gross churn worsens while failed-payment recovery stays healthy but new cohorts fall apart after month two, that smells like onboarding, fit, or expectation-setting.
Same metric. Different root cause. Different plan.
What founders should stop doing
There are three bad habits worth killing.
First, stop reporting gross churn without cause breakdowns. A naked number is tidy but strategically weak.
Second, stop treating failed payments as background admin. If recoverable revenue is falling out of Stripe because your update flow is clunky, that is not finance housekeeping. It is churn.
Third, stop assuming one retention metric can carry the whole narrative. SaaS is messier than that. Good operators accept the mess, then instrument it properly.
One practical improvement is auditing the path from failed invoice to recovered payment. If that sequence is fuzzy, slow, or inconsistent, you probably have more involuntary churn than your top-line dashboard suggests. Pages like Stripe payment method update links matter because recovery often wins or loses in the customer handoff, not just in the retry schedule.
The real job of gross churn rate
Gross churn rate still matters. It is a sharp metric when used correctly.
Its job is to tell you that revenue left the building. It is not supposed to explain every reason, every failure mode, or every fix. Problems start when teams ask it to do more than it can.
Treat gross churn as the first question, not the final answer.
If you do that, the metric becomes useful again. It pushes you to investigate. It creates urgency without pretending to provide certainty. And it helps you separate the losses you must live with from the ones you should have recovered.
That is the whole point.
If you want to find out how much of your churn is actually recoverable billing loss, run a free audit at ChurnBot.
Related Posts

7 Payment Recovery KPIs Every Stripe Team Should Track

7 Failed Payment Segments Every Stripe Team Should Track

9 Strategies to Stop Losing Customers to Payment Failures
How healthy is your Stripe account?
Get a free churn health report. Find pending cancellations, failed payments, and expiring cards putting your MRR at risk.
Run Free Audit